Visualising sound 02
Waveform diagrams
- Video
- Script
Welcome to this tutorial on waveform diagrams.
Because it is difficult to visualise sound, we use a diagram to represent it's pattern of changing air pressure over time. These diagrams are called waveform diagrams and they have become the standard way to represent sound pictorially in print and software.
Caption - Sine wave
When a source expands and contracts absolutely consistently it is said to be vibrating in simple harmonic motion. The wave it produces is known as a sine wave.
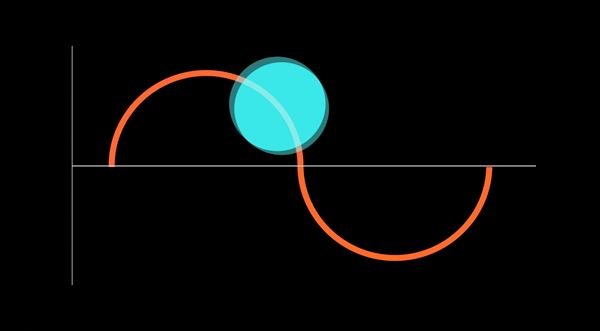
The waveform diagrams in this video show a sine wave. We could have used any other wave, but a sine wave is nice and simple, and makes it easier to explain how the diagrams work.
A single isolated sine wave can only be created by an electronic sound source, a so called oscillator, which can create an electrical pressure soundwave according to the strict mathematical principals of electronic design. Isolated sine waves are unfound in nature, because all natural sound sources vibrate in complex ways. However, a complex sound can be considered to be made from hundreds or thousands of individual sine wave vibrations.
Caption - Waveform diagrams
Waveform diagrams contain the following elements ..
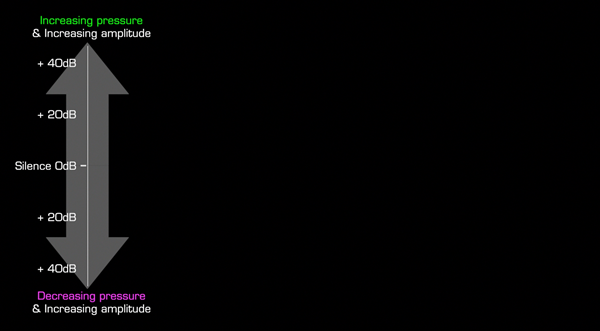
Bi-polar amplitude axis showing normal air pressure and silence, increasing pressure and increasing amplitude, and decreasing pressure and increasing amplitude.
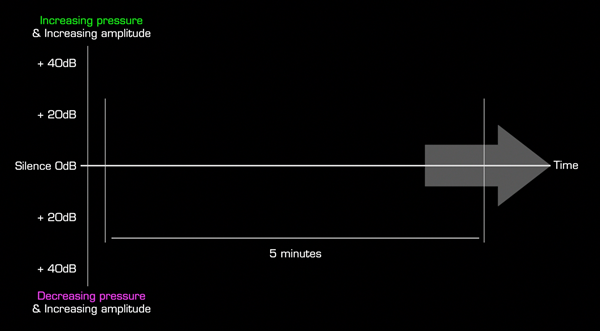
Time axis - which can expand and contract to show any duration from a few milliseconds to several hours
A curving line which plots the changing pattern of air pressure energy from compression to rarefaction
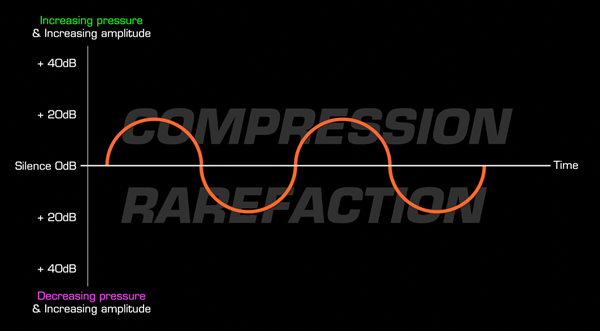
One or more cycles
Wavelength
and finally .. frequency or the number of cycles per second
Caption - Amplitude
The "amount" of compression and rarefaction of the air is expressed as the amplitude of the soundwave. It is the volume or loudness which the ear perceives. As long as the air pressure is changing (rising and falling), sound will be heard. The greater the rise and fall, the louder the amplitude, or volume.
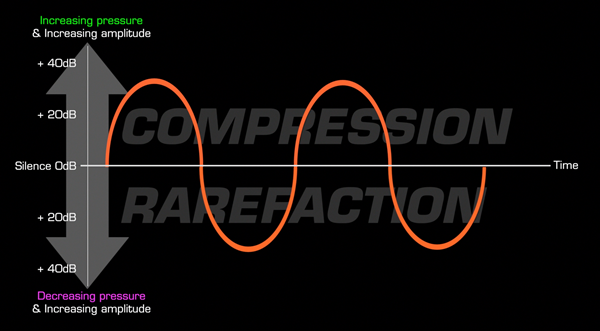
It is critical to note that waveform diagrams show amplitude on a bi-polar axis, and that silence is shown as a flat horizontal line (the horizontal axis).
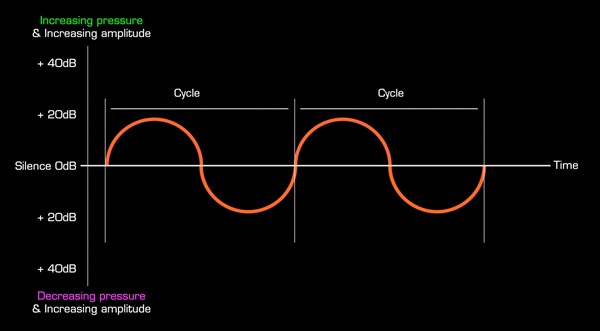
Caption - Cycles
When a source has expanded and contracted once it is said to have cycled. This is a single vibration. Almost all sounds cycle multiple times.
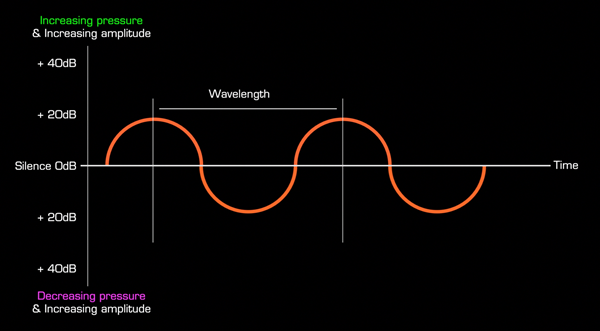
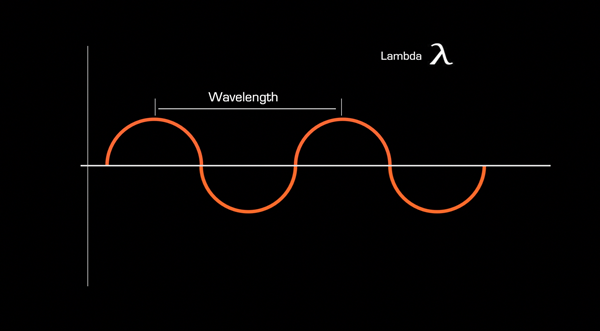
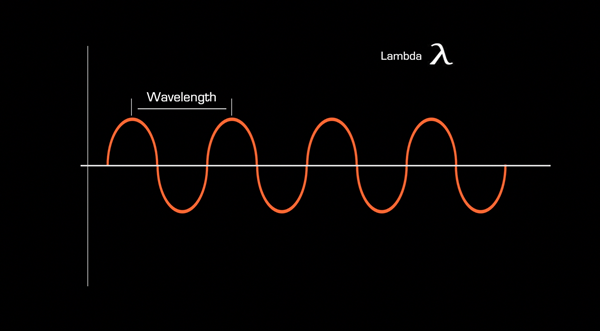
Caption - Wavelength
The physical distance between two adjacent points on a sound wave, that is from any point on one cycle to the same point on the following cycle, is known as the wavelength and is denoted by the Greek letter lambda. Because a sound source can vibrate at many different speeds, or frequencies, this wavelength is variable.
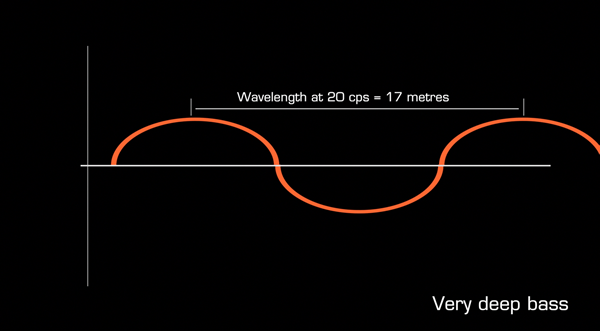
The wavelength of sound at 20 cycles per second (deep bass) is approximately 17 metres.
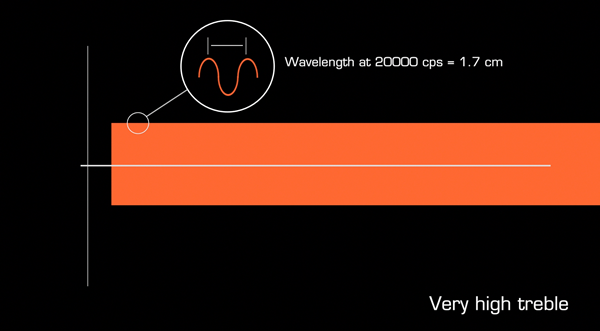
The wavelength of sound at 20,000 cycles per seconds (high treble) is 1.7 cm.
Wavelength is critical to understanding of how sound behaves when it encounters a physical obstruction.
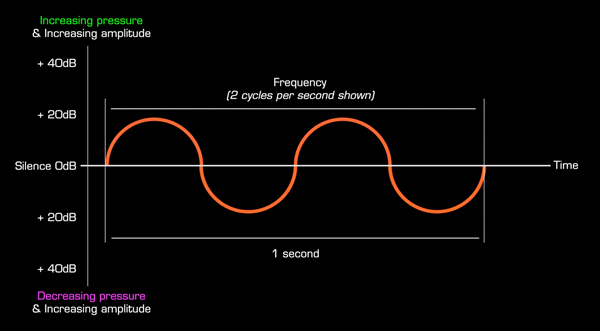
Caption - Frequency
The speed at which the source vibrates is known as the frequency of the soundwave and is expressed in hertz (Hz) or cycles per second (cps). 1000 hertz = 1 kilohertz (kHz).
Humans can hear frequencies between 20Hz and 20KHz. This is known as the audio spectrum.
Caption - Waveform diagrams employed by audio software
Waveform digram are the standard way to visualise soundwaves in audio software.
Caption - Thanks for watching
The script for this video, with accompanying images, can be found at projectstudiohandbook.com
We suggest you subscribe at our YouTube channel, and join our mailing list at our website to receive notification of new videos, blog posts and subscriber only extras.
Thanks for watching.